Revealing the Invisible
Using design to reshape how we experience data
Attention is a tricky thing. It’s hard to notice something that you don’t know to look for. But as designers, we have the ability to command attention, and present information in new and engaging ways. With the proliferation of sensors and digital life comes an endless stream of data points requiring context and translation. Data visualization has arguably never been more in-demand. The value of data will remain illegible unless designers figure out how to reveal connections, communicate analysis, and make the invisible visible.
At SPAN Newcastle-Gateshead we set out with our partner It’s Nice That (INT) to do just that. INT identified and assembled a collaborative team, pairing up data scientists from the Urban Observatory—an organization responsible for capturing the UK’s largest public set of urban data—with designers from NOVAK, developer James Rutherford, and sound artists Ed Carter and Tim Shaw to shed light on the city's air quality by presenting pollution data in a new, engaging way.
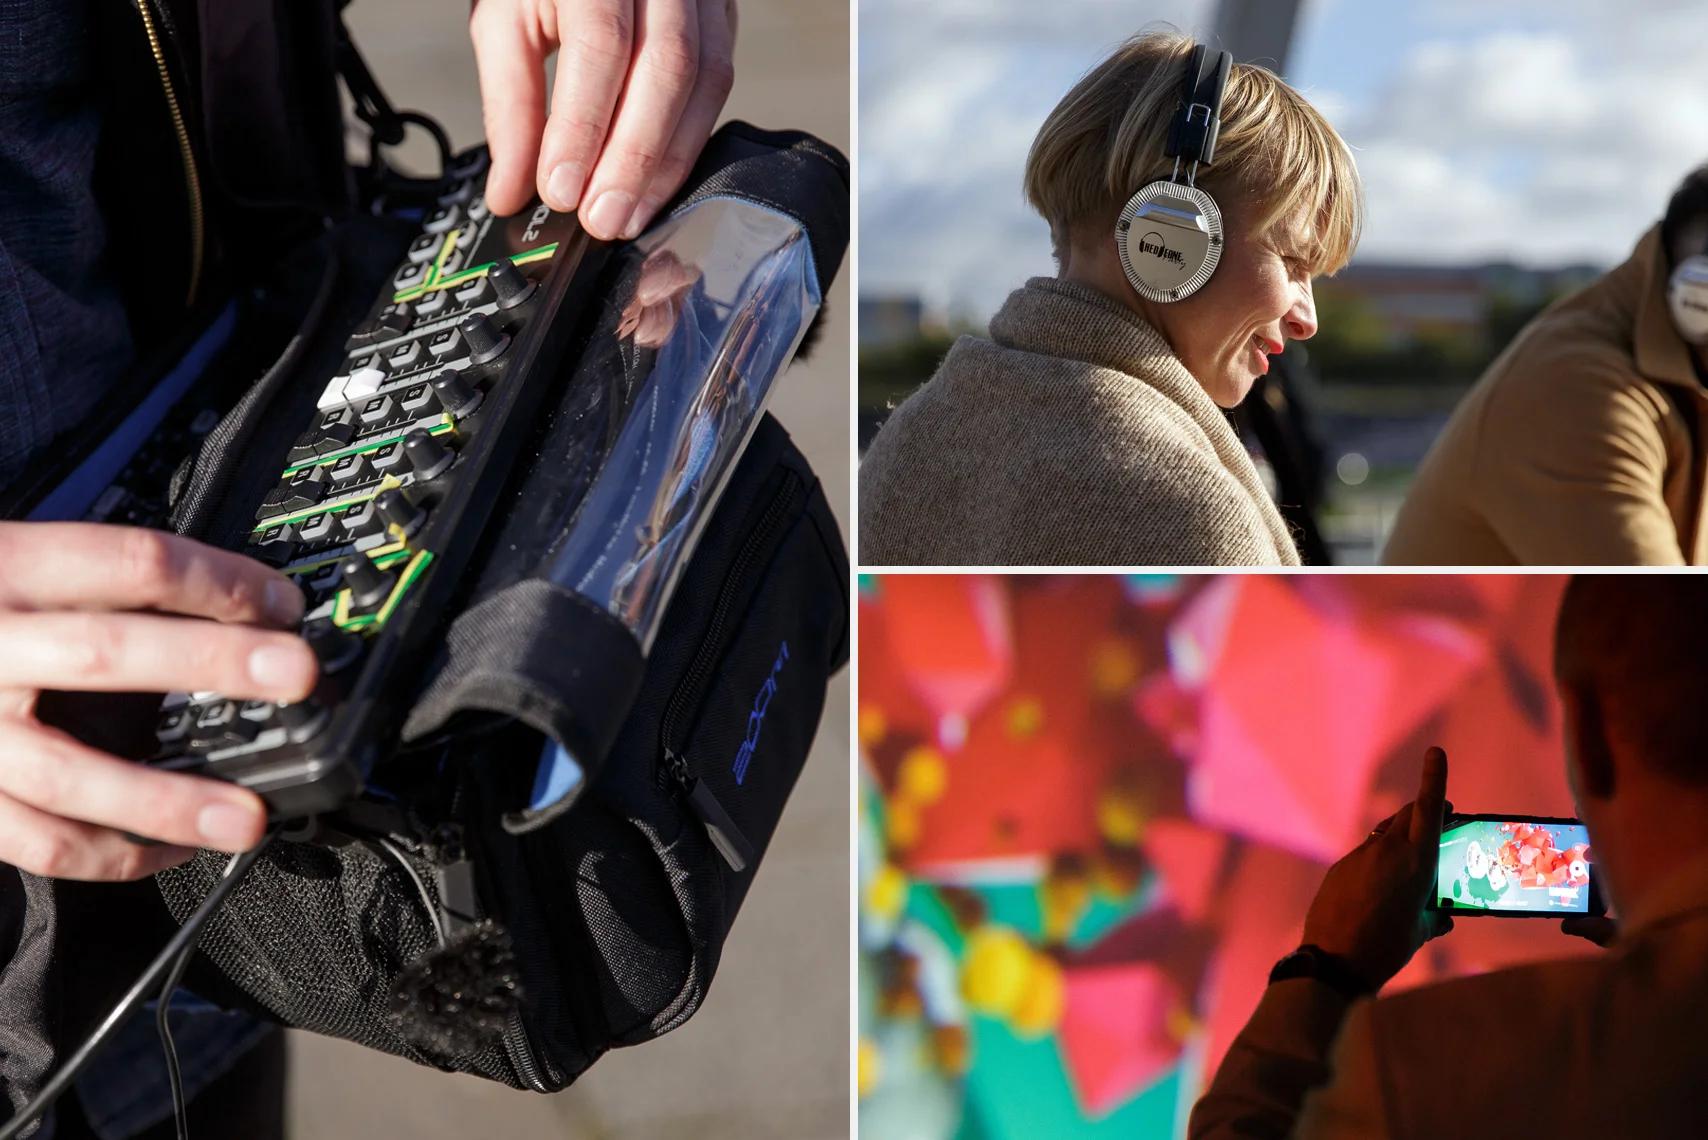
Clockwise from left: Artist Tim Shaw live-mixes an audio composition on the sound walk, a participant listens in over their headphones, an event attendee takes a photo of the final data visualization
The challenge
Newcastle University’s Urban Observatory deploys hundreds of on-the-ground sensors to capture everything from air particulates to sound pollution, rainfall, wind direction, solar radiation, and more. They’ve created the country’s largest set of open, urban data, but this trove of free information is used primarily by researchers communicating within academic circles. Could artists and designers help get this information in front of average citizens? Could they use data viz to change how people saw and experienced air pollution?
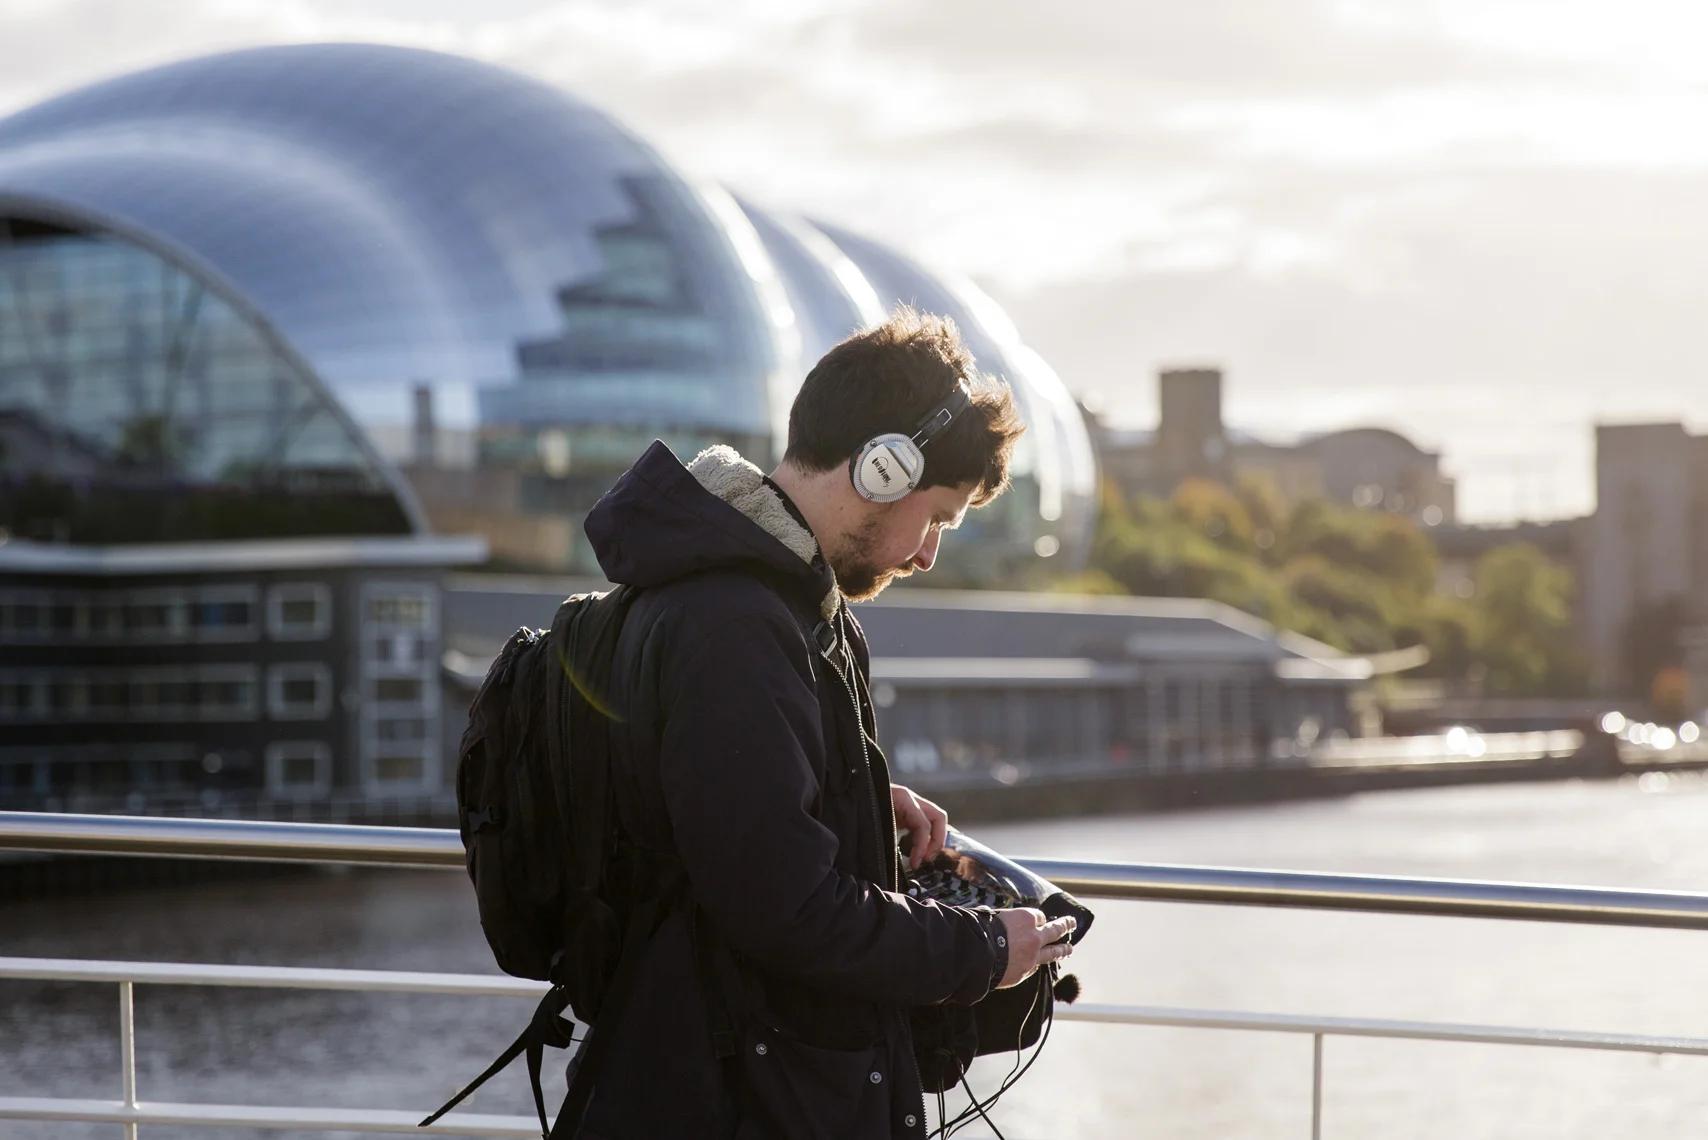
Tim Shaw pauses on the Gateshead Millennium Bridge while creating a 'sonification' of the pollution data
The walks
Tim Shaw and Ed Carter decided to combine field recordings with audio representations of pollution data to draw attention to urban space and its aray of unseen air particles. The artists lead two groups of SPAN workshop participants on separate half-hour-long walks through Newcastle-Gateshead, recording and live-mixing the sounds around them into new audio tracks. Participants wore wireless headphones so they could listen along, while data-collectors from Urban Observatory carried finely tuned devices that captured airborne pollution data and represented it as boops and beeps in the audio composition.
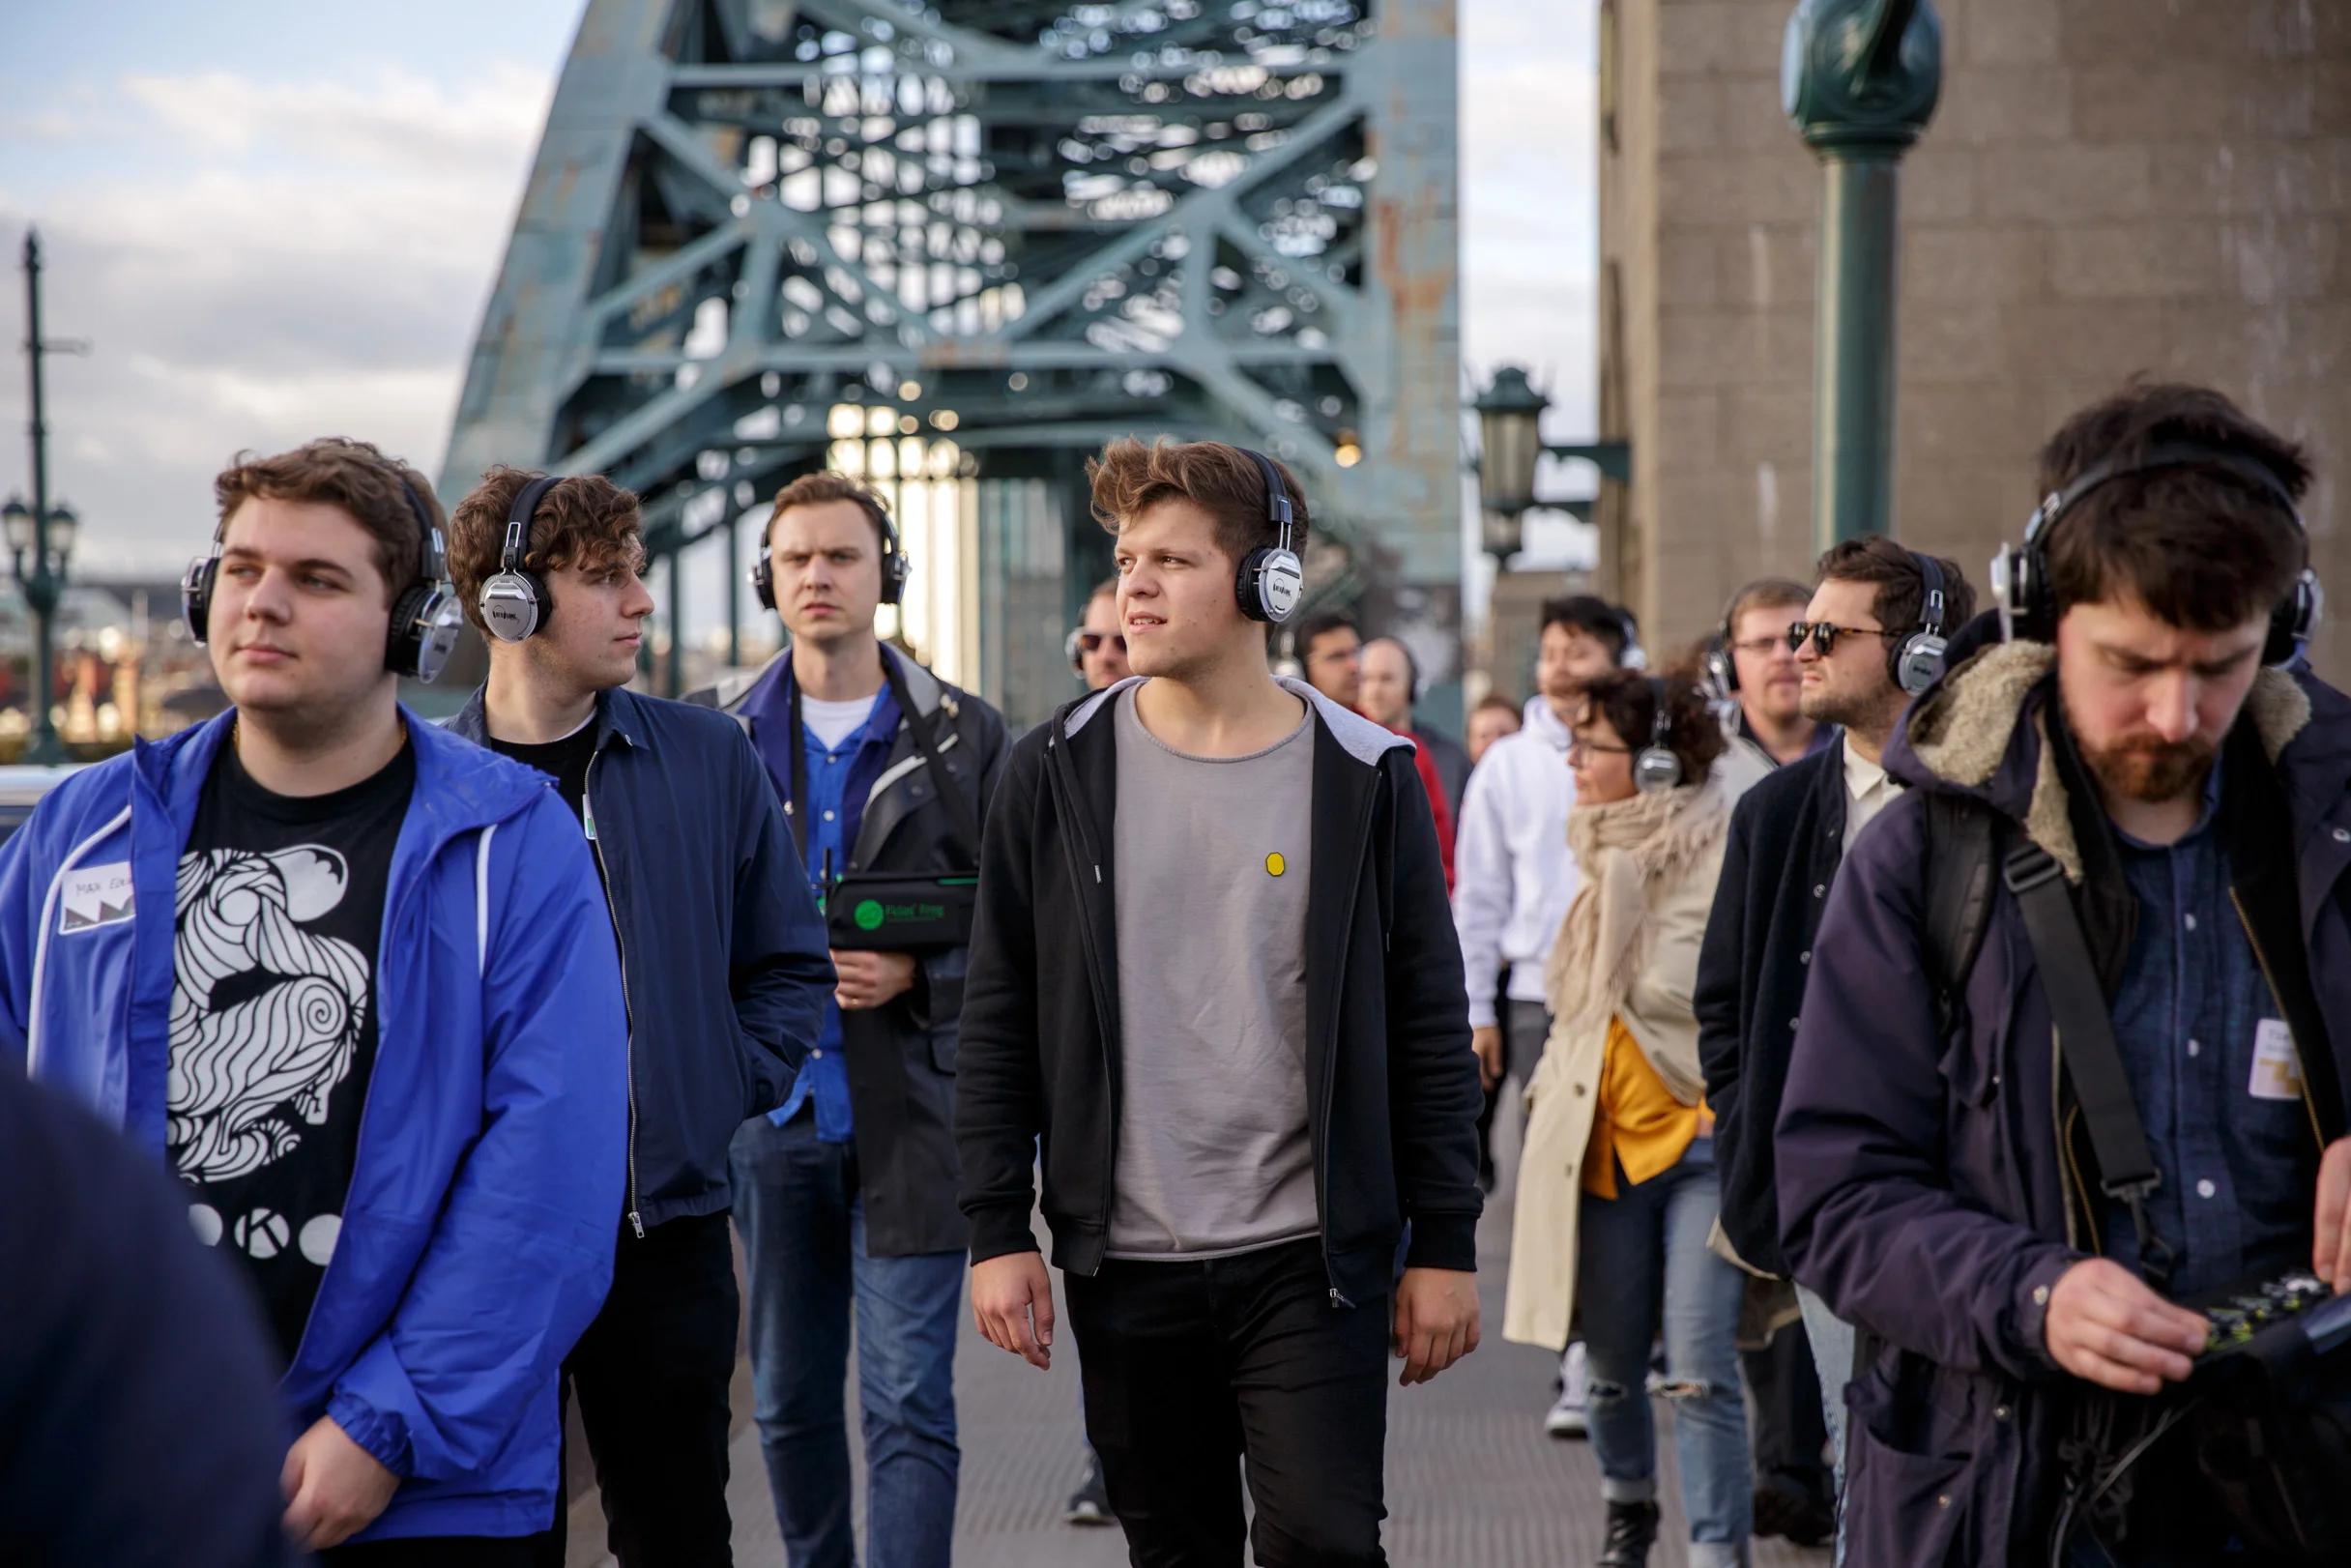
Participants listen along as they walk through Newcastle-Gateshead
The visualization
At the end of the walk, NOVAK fed the pollution data through a games engine, representing the size and amount of airborne particulates in a custom visualization. The sensors picked up four sizes of particles ranging from the smallest (pm1) to the largest (pm10). Each particle type was displayed as a different shape and color. The volume of the particles, their placement, and movement was all dictated by the data. The visualizations were projected onto an entire wall of the SPAN event space and played in sync with the ‘sonifications’ created by Tim Shaw and Ed Carter, connecting the experience of the walk to the levels of pollution.
The final result was an expression of data that went well beyond numbers in a chart. From the walks to the sound compositions and final projections, each multi-sensory element contributed to a richer understanding of our relationship to air pollution and the ways it surrounds us—unseen and unheard—every day.
Read more about the SPAN talks and takeaways over at It's Nice That.
Many thanks to everyone who helped make this workshop a reality, including: It’s Nice That, Phil James of the Urban Observatory, Adam Finlay and the NOVAK team, Ed Carter, Tim Shaw, James Rutherford, and BALTIC.